In the modern industrial landscape, maintenance has undergone a massive paradigm shift. It is no longer viewed simply as a “necessary evil” or a cost center, but rather as a strategic value creator and an integral part of the business process. However, establishing exactly how much value is being created requires tracking the right data.
A Maintenance KPI Dashboard bridges the gap between raw data and actionable strategy. By leveraging a well-designed dashboard powered by a Computerized Maintenance Management System (CMMS), organizations can align their daily operations with long-term corporate goals, driving unprecedented plant performance.
Here is an in-depth look at how implementing a maintenance KPI dashboard can transform your plant operations.
1. Mastering the 4 Core Reliability Metrics
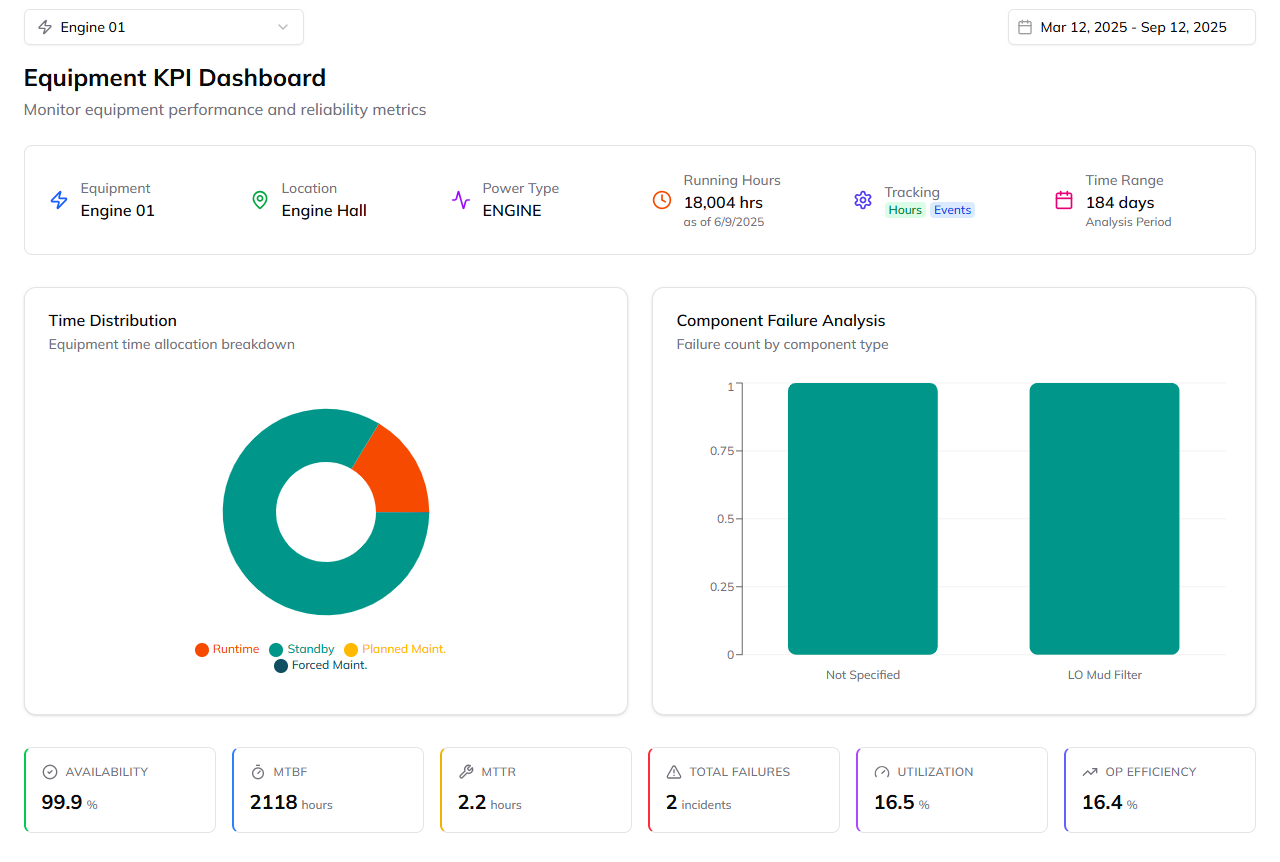
A dashboard instantly visualizes the metrics that determine whether your maintenance strategy is proactive or reactive. To ensure plant performance improves, your dashboard must prominently feature these four foundational metrics:
- MTTF (Mean Time To Failure): Tracks how long equipment operates continuously before a breakdown occurs.
- MTTD (Mean Time To Detect): Measures how quickly your team identifies a failure. Faster detection equals less downtime.
- MTTR (Mean Time To Repair): Calculates how fast your team restores a machine to working condition. Reducing MTTR directly translates to cost savings.
- MTBF (Mean Time Between Failures): Evaluates the total uptime achieved between failures. A higher MTBF indicates highly reliable equipment and superior maintenance practices.
As the saying goes: what gets measured, gets improved. Visualizing these KPIs helps teams shift from a “firefighting” mindset to forecasting and prevention.
2. Bridging the Gap Between Strategy and the Shop Floor
A critical gap in many manufacturing enterprises is the disconnect between top-level business strategies and shop-floor maintenance actions.
A KPI dashboard solves this by creating a multi-criteria hierarchical framework. It translates high-level corporate objectives (like reducing overall operational costs) into tactical and operational targets (such as daily work order completion rates or technical stops). By cascading these metrics down to individual equipment levels, every operator and engineer understands how their daily tasks impact the broader business.
3. Measuring Total Maintenance Effectiveness (Internal vs. External)
Many plants mistakenly focus solely on internal efficiency metrics, such as Overall Equipment Effectiveness (OEE). While OEE is critical, a comprehensive KPI dashboard also tracks External Effectiveness.
- Internal Effectiveness: Focuses on doing things right, measuring factors like maintenance cost per unit, productivity, and resource utilization.
- External Effectiveness: Focuses on delivering exactly what the customer (or wider business) needs, measuring safety, health and environmental (HSE) compliance, customer satisfaction, and timeliness of delivery.
A robust dashboard visualizes Total Maintenance Effectiveness, which is the product of both internal efficiency and external outcomes.
4. Ensuring Data Integrity and Traceability
A dashboard is only as good as the data feeding it. Using outdated spreadsheets or systems with poor data compliance can completely discredit your performance metrics.
Integrating your dashboard with a modern CMMS—such as the Wrysto-WRMS—ensures absolute data integrity. A structured CMMS workflow guarantees that:
- Role-Based Access Control (RBAC): Only authorized personnel can initiate, assign, or close work orders, ensuring data cannot be manipulated.
- Timestamped Actions: Every phase of a work order (from PLACED to PENDING to FINISHED) is digitally timestamped. This provides exact data for calculating MTTR and MTTD.
- Forced Compliance: Built-in digital checkpoints, such as mandatory “Confirm Isolation” steps by operation engineers before work begins, ensure safety while guaranteeing data is completely logged.
5. Driving Continuous Improvement (The PDCA Cycle)
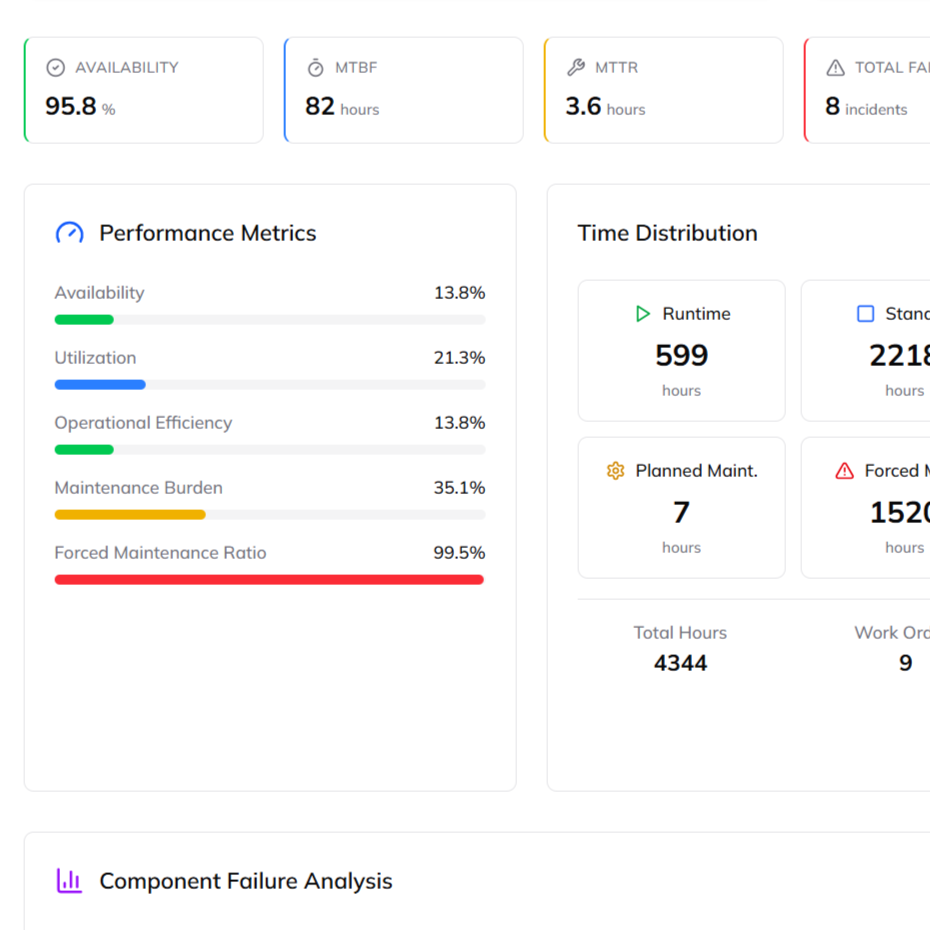
Identifying performance gaps empowers you to develop targeted strategies that align with industry best practices. A KPI dashboard is the ultimate tool for the Plan-Do-Check-Act (PDCA) continuous improvement cycle.
By actively monitoring your dashboard, you can quickly spot when metrics fall below their target range. A well-managed dashboard acts as a deviation reporting system, creating a continuous feedback and action closure loop. When a metric like MTBF starts to drop, management can immediately trigger a root cause analysis, adapt the maintenance plan, and close the performance gap before it causes catastrophic downtime.
Summary
Ultimately, machines fail silently until a strategic maintenance system listens loudly. A maintenance KPI dashboard gives your plant a voice. By replacing manual spreadsheets with real-time tracking, unifying shop-floor actions with business goals, and tracking metrics like MTBF and MTTR, a dashboard transforms raw data into a competitive advantage that maximizes equipment uptime and operational ROI.
